

Pairs Trading. Introduction
With this post I start a series of articles where I am going to describe, implement and test different aspects of pairs trading strategies.

The basic idea of pairs trading is to find pairs of securities (usually subject to similar risks) which tend to move together. We expect to find a long term equilibrium relationship between the prices of these securities. Whenever we notice deviations from the equilibrium, we can exploit it and make a profit.
There is a Chinese adaptation of this article prepared by Yuan Di. It is available here.
There are many articles describing general aspects of pairs trading strategies. For example, see this, this and this. Let’s see how it works on a simple example with synthetic data.
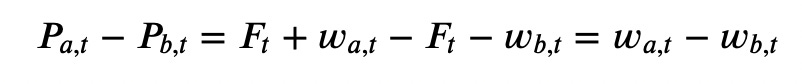
First we need to generate stock price series. Let’s say that we have two stocks: A and B. Their prices depend on a common factor F plus some noise. Assume that F follows a random walk process. Then we have:
Below you can see the python code used to generate stock prices. We generate 252 data points, which we can think of as one year (252 trading days) of daily close prices.
| import numpy as np | |
| import matplotlib.pyplot as plt | |
| # generate random walk series | |
| np.random.seed(112) | |
| F = [50] | |
| for i in range(252): | |
| F.append(F[i] + np.random.randn()) | |
| F = np.array(F) | |
| # generate price series | |
| P_a = F + np.random.randn(len(F)) | |
| P_b = F + np.random.randn(len(F)) |
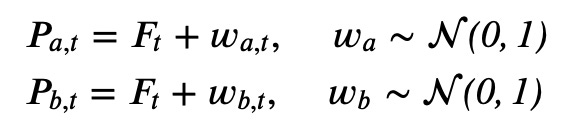
Now let’s plot the generated prices.
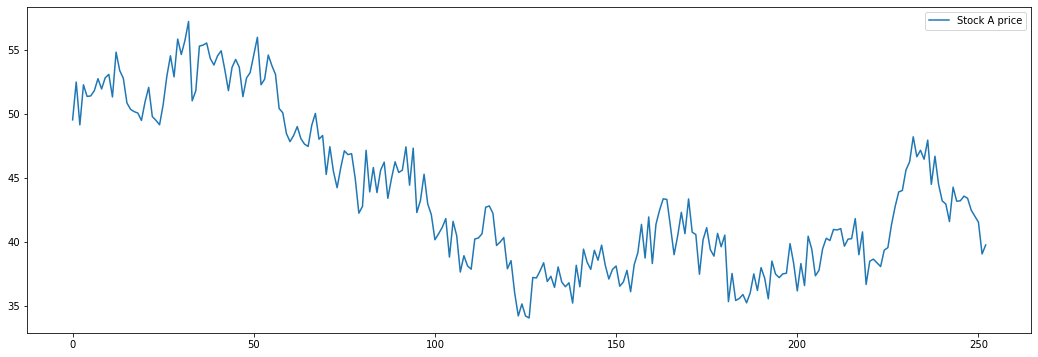
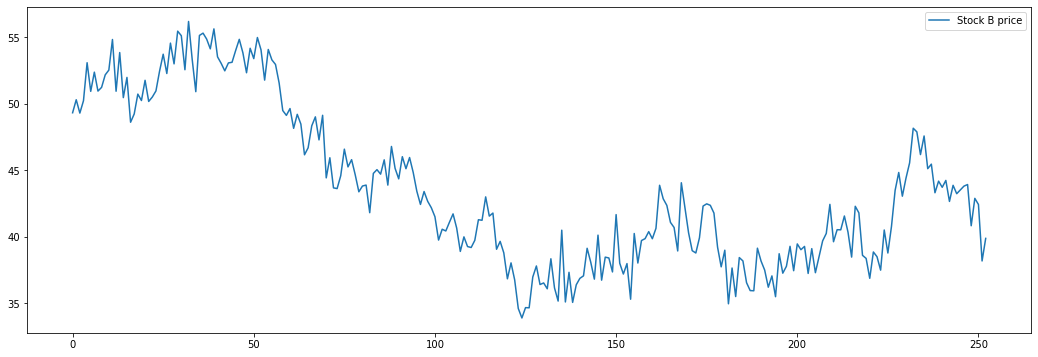
If we consider price series of two stocks separately, they look like a random walk (which they are) and we don’t see any obvious way to predict their future movements. Let’s plot both series together.
Here we can notice that prices tend to move together. How can we use this? Assume that we create a portfolio by taking a long position in stock A and a short position in stock B. What will the portfolio price look like?
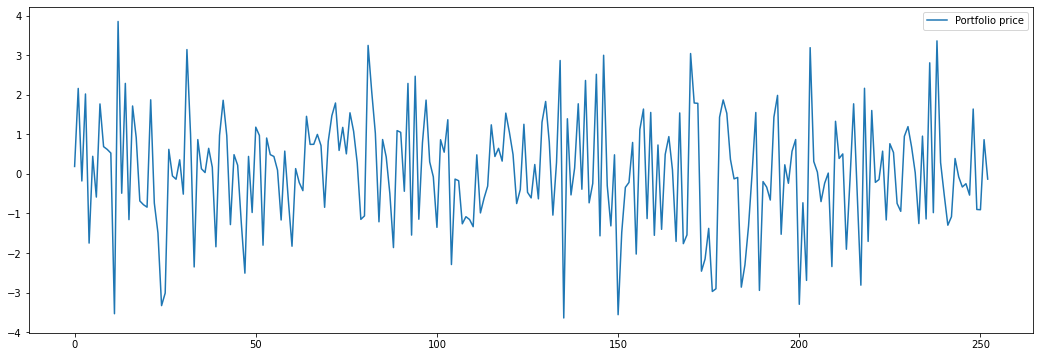
We can see that the resulting time series demonstrate mean reverting behavior. Portfolio price oscillates around zero. Basically by creating such portfolio we were able to cancel the random walk component of individual stock price series and now we are left only with the white noise components:
If we observe that portfolio price is lower\higher than zero, we expect it to return back to zero. Assume that we open a position when the portfolio price deviates from its mean by more than 2 historical standard deviations:
open long position when portfolio price is more than 2 standard deviations below the mean
close long position when portfolio price crosses the mean from below
open short position when portfolio price is more than 2 standard deviations above the mean
close short position when portfolio price crosses the mean from above
Below is the plot of portfolio price with 2-SD bands and positions that we should take (+1: long position, -1: short position, 0: no position)
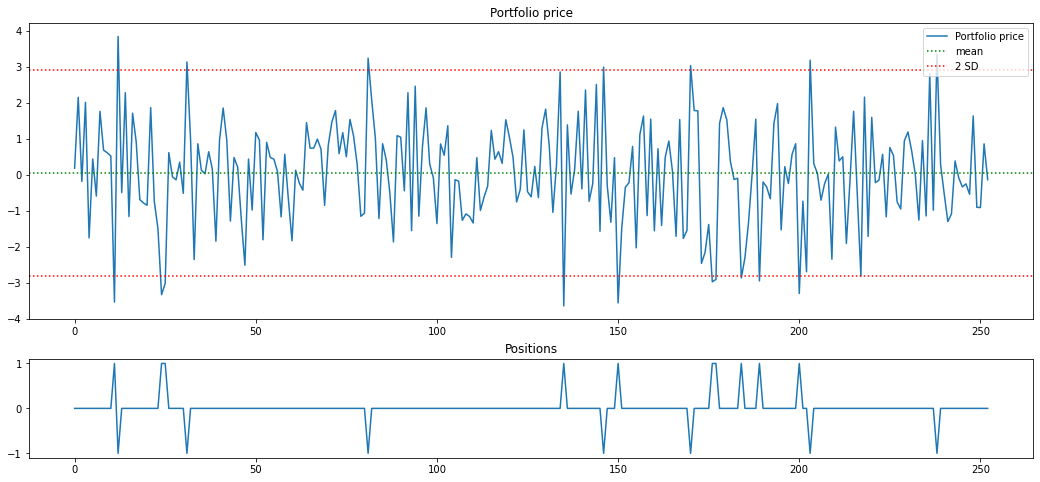
There are 15 trading opportunities displayed on the plot above. If we were to trade a portfolio consisting of one share of stock A and one share stock B, then we could earn approximately $43 profit ($2.87 per trade). If we traded a portfolio consisting of 100 shares of stock A and 100 shares of stock B, then our gains and losses should be multiplied by 100, giving a profit of $4300.
This synthetic example demonstrates the general principle of pairs trading. Of course in real life it is a lot more complicated. In the following articles I will describe several methods of pair selection and apply them to real world data.
Jupyter notebook with source code is available here.
If you have any questions, suggestions or corrections please post them in the comments. Thanks for reading.